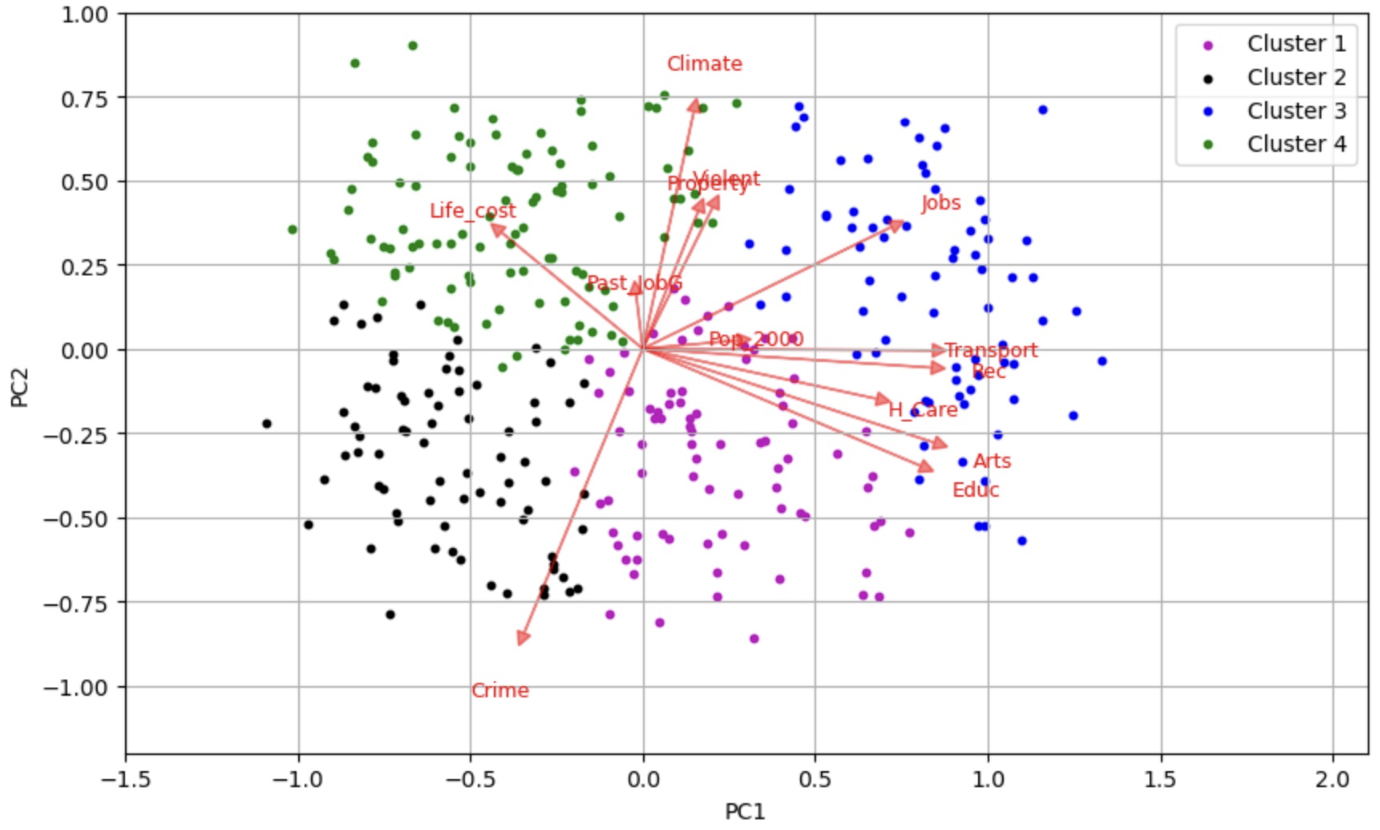
A marketing strategy requires to group a large set of US metropolitan cities into clusters. It was deemed critical to characterize the cities in each of the clusters. A K-Means algorithm was used to cluster the cities and a biplot and pivot tables were used to characterize the cities in each cluster. It was found which attributes the cities in each cluster have in common and how much the cities from different clusters are distinct. This solution helped the Director to efficiently allocate resources and marketing efforts to the different clusters attaining the best possible revenue per dollar invested.